
Loxone · Energy
Loxone Energy Management — Metering, PV, Storage and Load Control
Energy management on a Loxone platform: sub-metering, PV and storage, EV charging, load control, baselines and consumption alarms in one building model.
Quick answer
Loxone energy management brings meters, PV inverters, storage and EV charging into one building model, then uses that data to change schedules, setpoints and loads. Consumption is measured at defined boundaries, normalised against weather and occupancy, and reviewed against a documented baseline, so an energy report ends in a control action rather than a spreadsheet.
From meter reading to control action
Most buildings already have meters. What they lack is a connection between consumption, cause and control. A meter on a distribution board says how much energy passed through it; it does not say which plant was running, which schedule was active or which tenant changed behaviour. We map meters to the equipment and areas they serve, bring the data into the same model as the HVAC and lighting logic, and use it to act. The output is a control layer that can shift a load, trim a setpoint or raise an alarm when consumption departs from its normal pattern. The value of an energy page is measured by the decisions it supports, not by the number of graphs it displays. A meter without a control action is an archive; a control action without a meter is a guess.
- Meters mapped to equipment, floor and tenant
- Consumption linked to schedules and setpoints
- Control actions available from the same platform
Metering boundaries and data quality
Energy reporting is only as good as its boundaries. We agree what is measured at the main incomer, at each floor or tenant, and at individual plant items, then check that the data arrives at a usable interval. Pulse inputs, Modbus registers, BACnet objects and utility APIs all behave differently; some are accurate enough for billing, others only for trends. Missing intervals, frozen values and meter resets are treated as faults, not silently interpolated. Current-transformer ratios, pulse weights and register scaling are recorded once and checked against a known load. Time synchronisation matters more than it appears: a report that compares two floors is meaningless if their meters disagree about when the interval started. A clear boundary diagram prevents the classic argument about who owns which kilowatt-hour. Where a meter is replaced, the change is recorded in the meter schedule so history does not silently split.
- Boundary diagram agreed before installation
- Interval data checked for gaps and resets
- Billing-grade and trend-grade data separated
Energy strategy by zone and system
Energy management works at three levels. At the building level, the main incomer sets the demand limit and the overall baseline. At the zone level, sub-meters and operating schedules show which floor, tenant or system is using more than its share. At the equipment level, runtime, valve position and supply temperatures show whether a plant item is doing useful work. We define which level each control action needs, because finer metering costs more and must earn its place. A tenant sub-meter supports allocation and anomaly alarms; a chiller sub-meter supports staging and maintenance; a lighting circuit meter may only be needed for reporting. The reporting tree and the control tree are designed together, so a number on a dashboard can always be traced back to a meter and a decision. A useful test is to ask, for each meter, which decision becomes possible that was not possible before.
- Building, zone and equipment level metering
- Each control action tied to the data it needs
- Reporting tree traceable to meters and decisions
PV, storage and EV charging
On-site generation changes the shape of the load. PV output, battery state of charge and building demand are read into one model, so the site can use its own generation before importing. A typical sequence charges storage from surplus PV, discharges it during the demand peak, and reserves a minimum state of charge for resilience if the owner asks for it. EV charging adds a flexible load that can be managed by schedule, by available capacity or by tariff signal, where the charging points expose an interface such as OCPP. Electrical protection, earthing, grid connection and the sizing of the installation remain with the responsible electrical engineer; the platform coordinates operation and reports what happened. Charge and discharge limits are confirmed with the battery supplier, and the platform never commands outside them. Export limitation, where required, is enforced by a dedicated controller, not by the building platform alone.
- PV generation, storage and site load in one view
- EV charging managed as a flexible load
- Electrical design and protection remain with the engineer
Load management and demand control
Demand control is a sequence, not a single command. When site demand approaches an agreed limit, the platform can stage non-critical loads down: trim ventilation, defer EV charging, raise a chilled-water setpoint within its allowed band, or shed decorative lighting. Each action has a priority and a recovery path, and each is logged so the operator can see why a zone changed. The sequence must respect comfort and process limits; a demand response that makes a tenant uncomfortably hot is a false economy. Before a load is shed, the platform checks that the plant can recover within the available time, and after the peak it restores loads in a defined order rather than all at once. Manual override is available, but it expires and is recorded. The demand limit itself is agreed with the utility or landlord, not set by the control engineer.
- Staged load shedding with priorities
- Recovery path and order for every action
- Comfort, process and override limits respected
Device selection, interfaces and wiring topology
Meters are selected for accuracy class, communication, mounting and the measurement they actually need. A Modbus RTU meter is wired as a daisy-chained bus with termination and a defined baud rate; pulse meters need debouncing and a known pulse weight; current transformers must match the meter and the cable they surround. Gateways sit close to the equipment and are powered from a circuit that survives the plant they monitor. The metering network is separated from tenant and guest networks, and time synchronisation is configured so intervals line up across devices. Drawings record the meter, the boundary it measures, the current-transformer ratio, the address and the data point it feeds. Spare communication ports and a spare meter way are planned where the owner expects future tenant fit-out. Labels at both ends of every bus segment save hours during a fault. A meter that is accurate but unreachable is a future blind spot.
- Meter selected by accuracy, protocol and mounting
- Bus termination, pulse weight and CT ratio recorded
- Segmented metering network with time synchronisation
Alarms, baselines, commissioning and handover
A baseline turns consumption into performance. We agree the normalisation method before the project starts, whether weather, occupancy, operating hours or production, and store the interval data needed to apply it. Alarms cover abnormal consumption, meter failure, communication loss and equipment degradation, not just a monthly total. Commissioning checks each meter against a known load, verifies the boundary sum, induces a communication fault and confirms the alarm reaches the right person. The first weeks of data are reviewed for gaps and strange patterns before any report is issued. Handover includes the boundary diagram, meter schedule, baseline method, alarm list, data export procedure and operator training on reading a trend rather than a single number. The platform does not verify a saving; it makes the evidence auditable. Reports are dated and versioned, and the baseline method is attached, so a later reader can see how the number was produced.
- Normalisation method agreed before the project
- Alarms for anomalies, meter faults and data gaps
- Boundary diagram, baseline method and training at handover
Energy scope, interfaces and response
14 rows| Energy scope | Typical interface | Measured value | Control or reporting response |
|---|---|---|---|
| Main incomer | Modbus, pulse, utility API | Total site demand and power factor | Demand limit, load shedding |
| Floor and tenant sub-meters | Modbus, pulse | Consumption by boundary | Allocation, anomaly alarms |
| Water meters | Pulse, Modbus | Volume by area or riser | Leak alarm, night-flow review |
| Gas meters | Pulse, Modbus | Volume and correction status | Boiler runtime comparison, anomaly alarm |
| Thermal and heat meters | Modbus, pulse | Flow, supply and return temperature, energy | Plant efficiency review, drift alarm |
| PV inverters | Modbus, API | Generation, availability and fault codes | Self-consumption priority, performance review |
| Battery storage | Modbus, API | State of charge, charge and discharge power | Charge scheduling, peak shaving |
| EV charging | OCPP, API | Session energy, availability and status | Load-managed charging, session reports |
| HVAC plant | BACnet/IP, Modbus | Runtime and energy by plant item | Setpoint and schedule adjustment |
| Lighting circuits | DALI, relays, sub-meters | Consumption by zone or floor | Schedule and dimming response |
| Plug loads and floor distribution | Sub-meters, smart sockets | Tenant and small-power consumption | Allocation, after-hours alert |
| Lifts and escalators | Modbus, dry contacts | Runtime, trips and energy where available | Standby mode, maintenance trend |
| External lighting and signage | Relays, sub-meters | Circuit status and consumption | Astronomical schedule, curfew |
| Generators, UPS and essential supplies | Modbus, dry contacts | Status, load and fuel or battery condition | Test scheduling, alarm escalation |
Project images
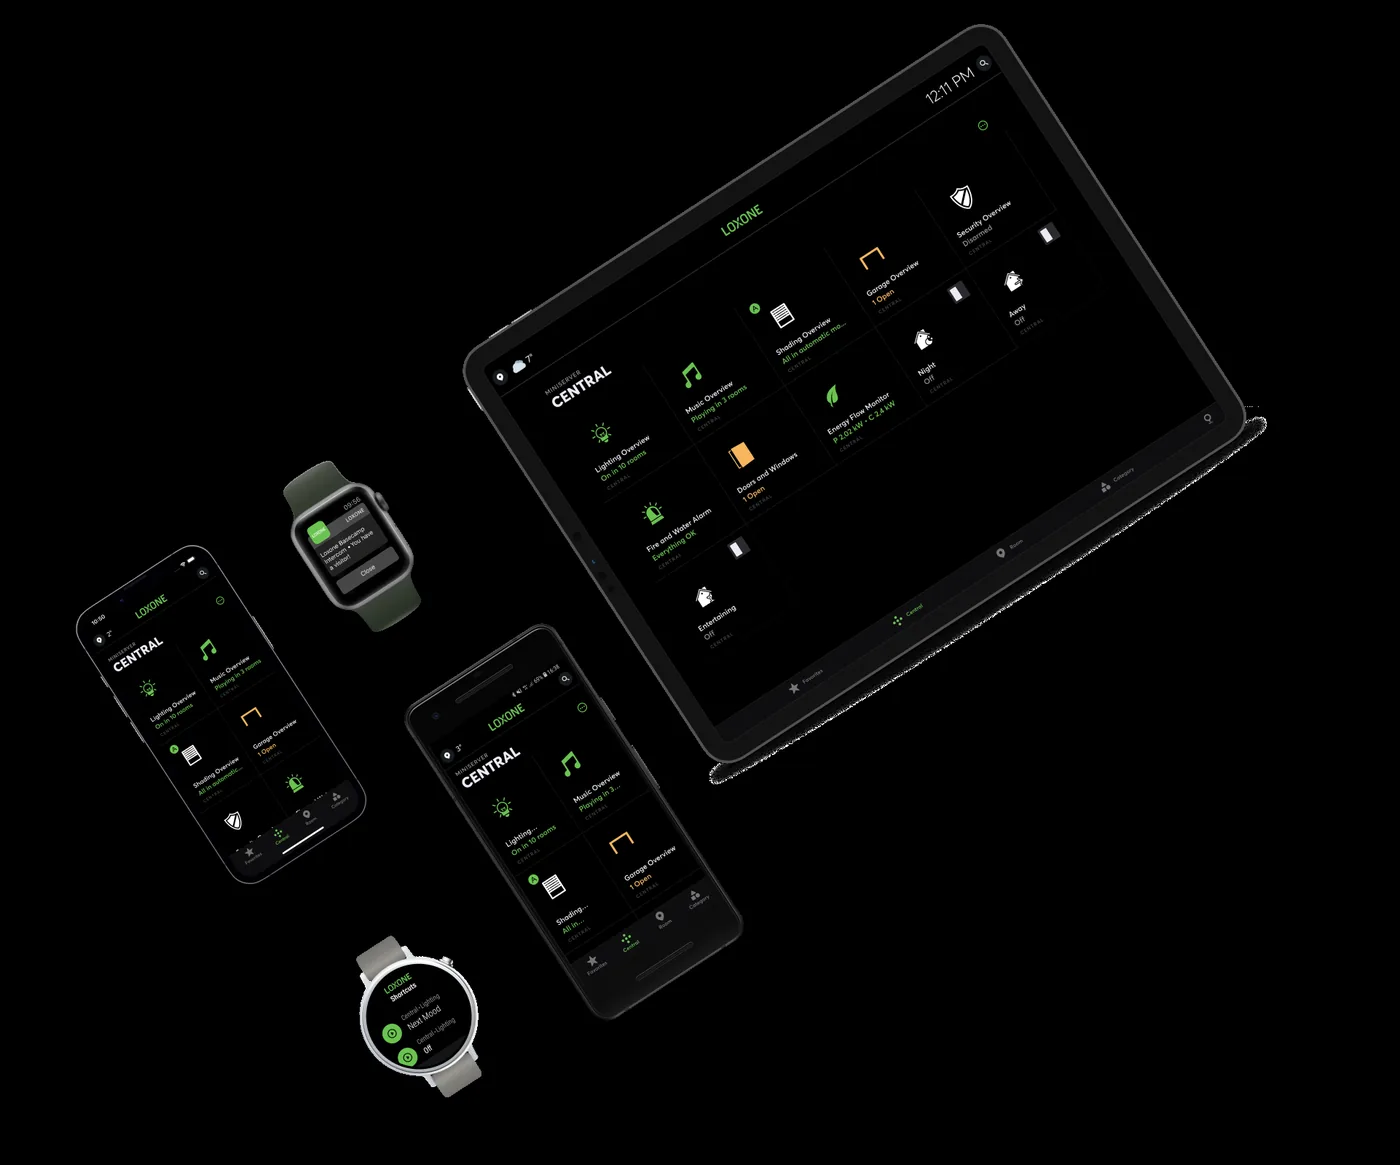
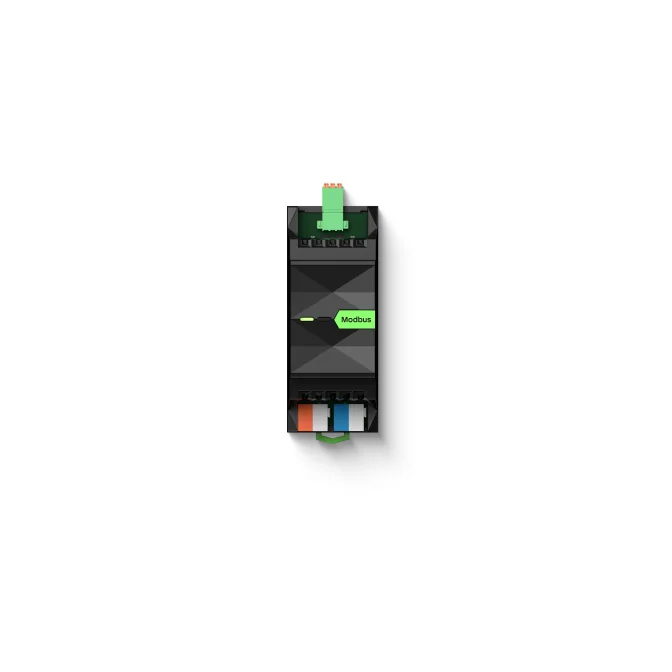
3 images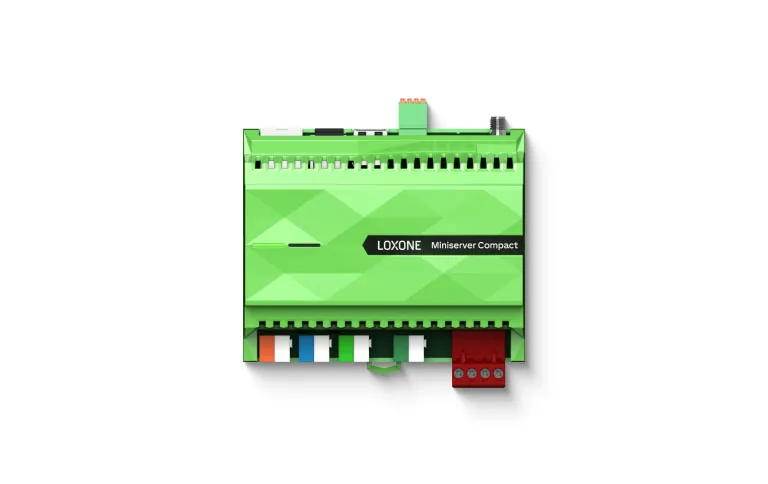
Frequently asked
01Do we need new meters?
Not always. Existing meters may be read through Modbus, BACnet, pulse inputs or utility APIs. The audit confirms the available interval and accuracy.
02Can you integrate PV and storage?
Yes, where the inverter or energy management system exposes Modbus, an API or dry contacts. The available control rights are confirmed before scope is committed.
03Is EV charging included?
OCPP-compatible charging points can be integrated for status, load management and billing data. Electrical design and protection remain a separate responsibility.
04How do you verify savings?
The baseline method is agreed before the project starts, then normalised consumption is tracked against it. Interval data is exported so the result can be reviewed independently.
05Does this replace utility bills?
No. It provides operational data and allocation, not a settlement bill. Billing-grade metering follows the utility or landlord's requirements.
06Can energy be allocated to tenants?
Yes, where the sub-metering boundaries support it. Allocation rules, common-area treatment and reporting periods are agreed with the owner before configuration.
07What happens if a meter fails?
Missing or frozen data raises an alarm. Any estimated value is flagged as an estimate rather than silently substituted, so reports keep their integrity.
Next step
Bring us the building.
Tell us the building type, systems in scope and the outcome you need. We will map the shortest path to a working system.